European MICE infographics
Five free, designer-crafted infographics on the realities of European hotel sourcing — industry size, response rates, lead-time savings, reply benchmarks, and where every euro of a typical €60K event actually goes. Embed them anywhere; just keep the credit link.
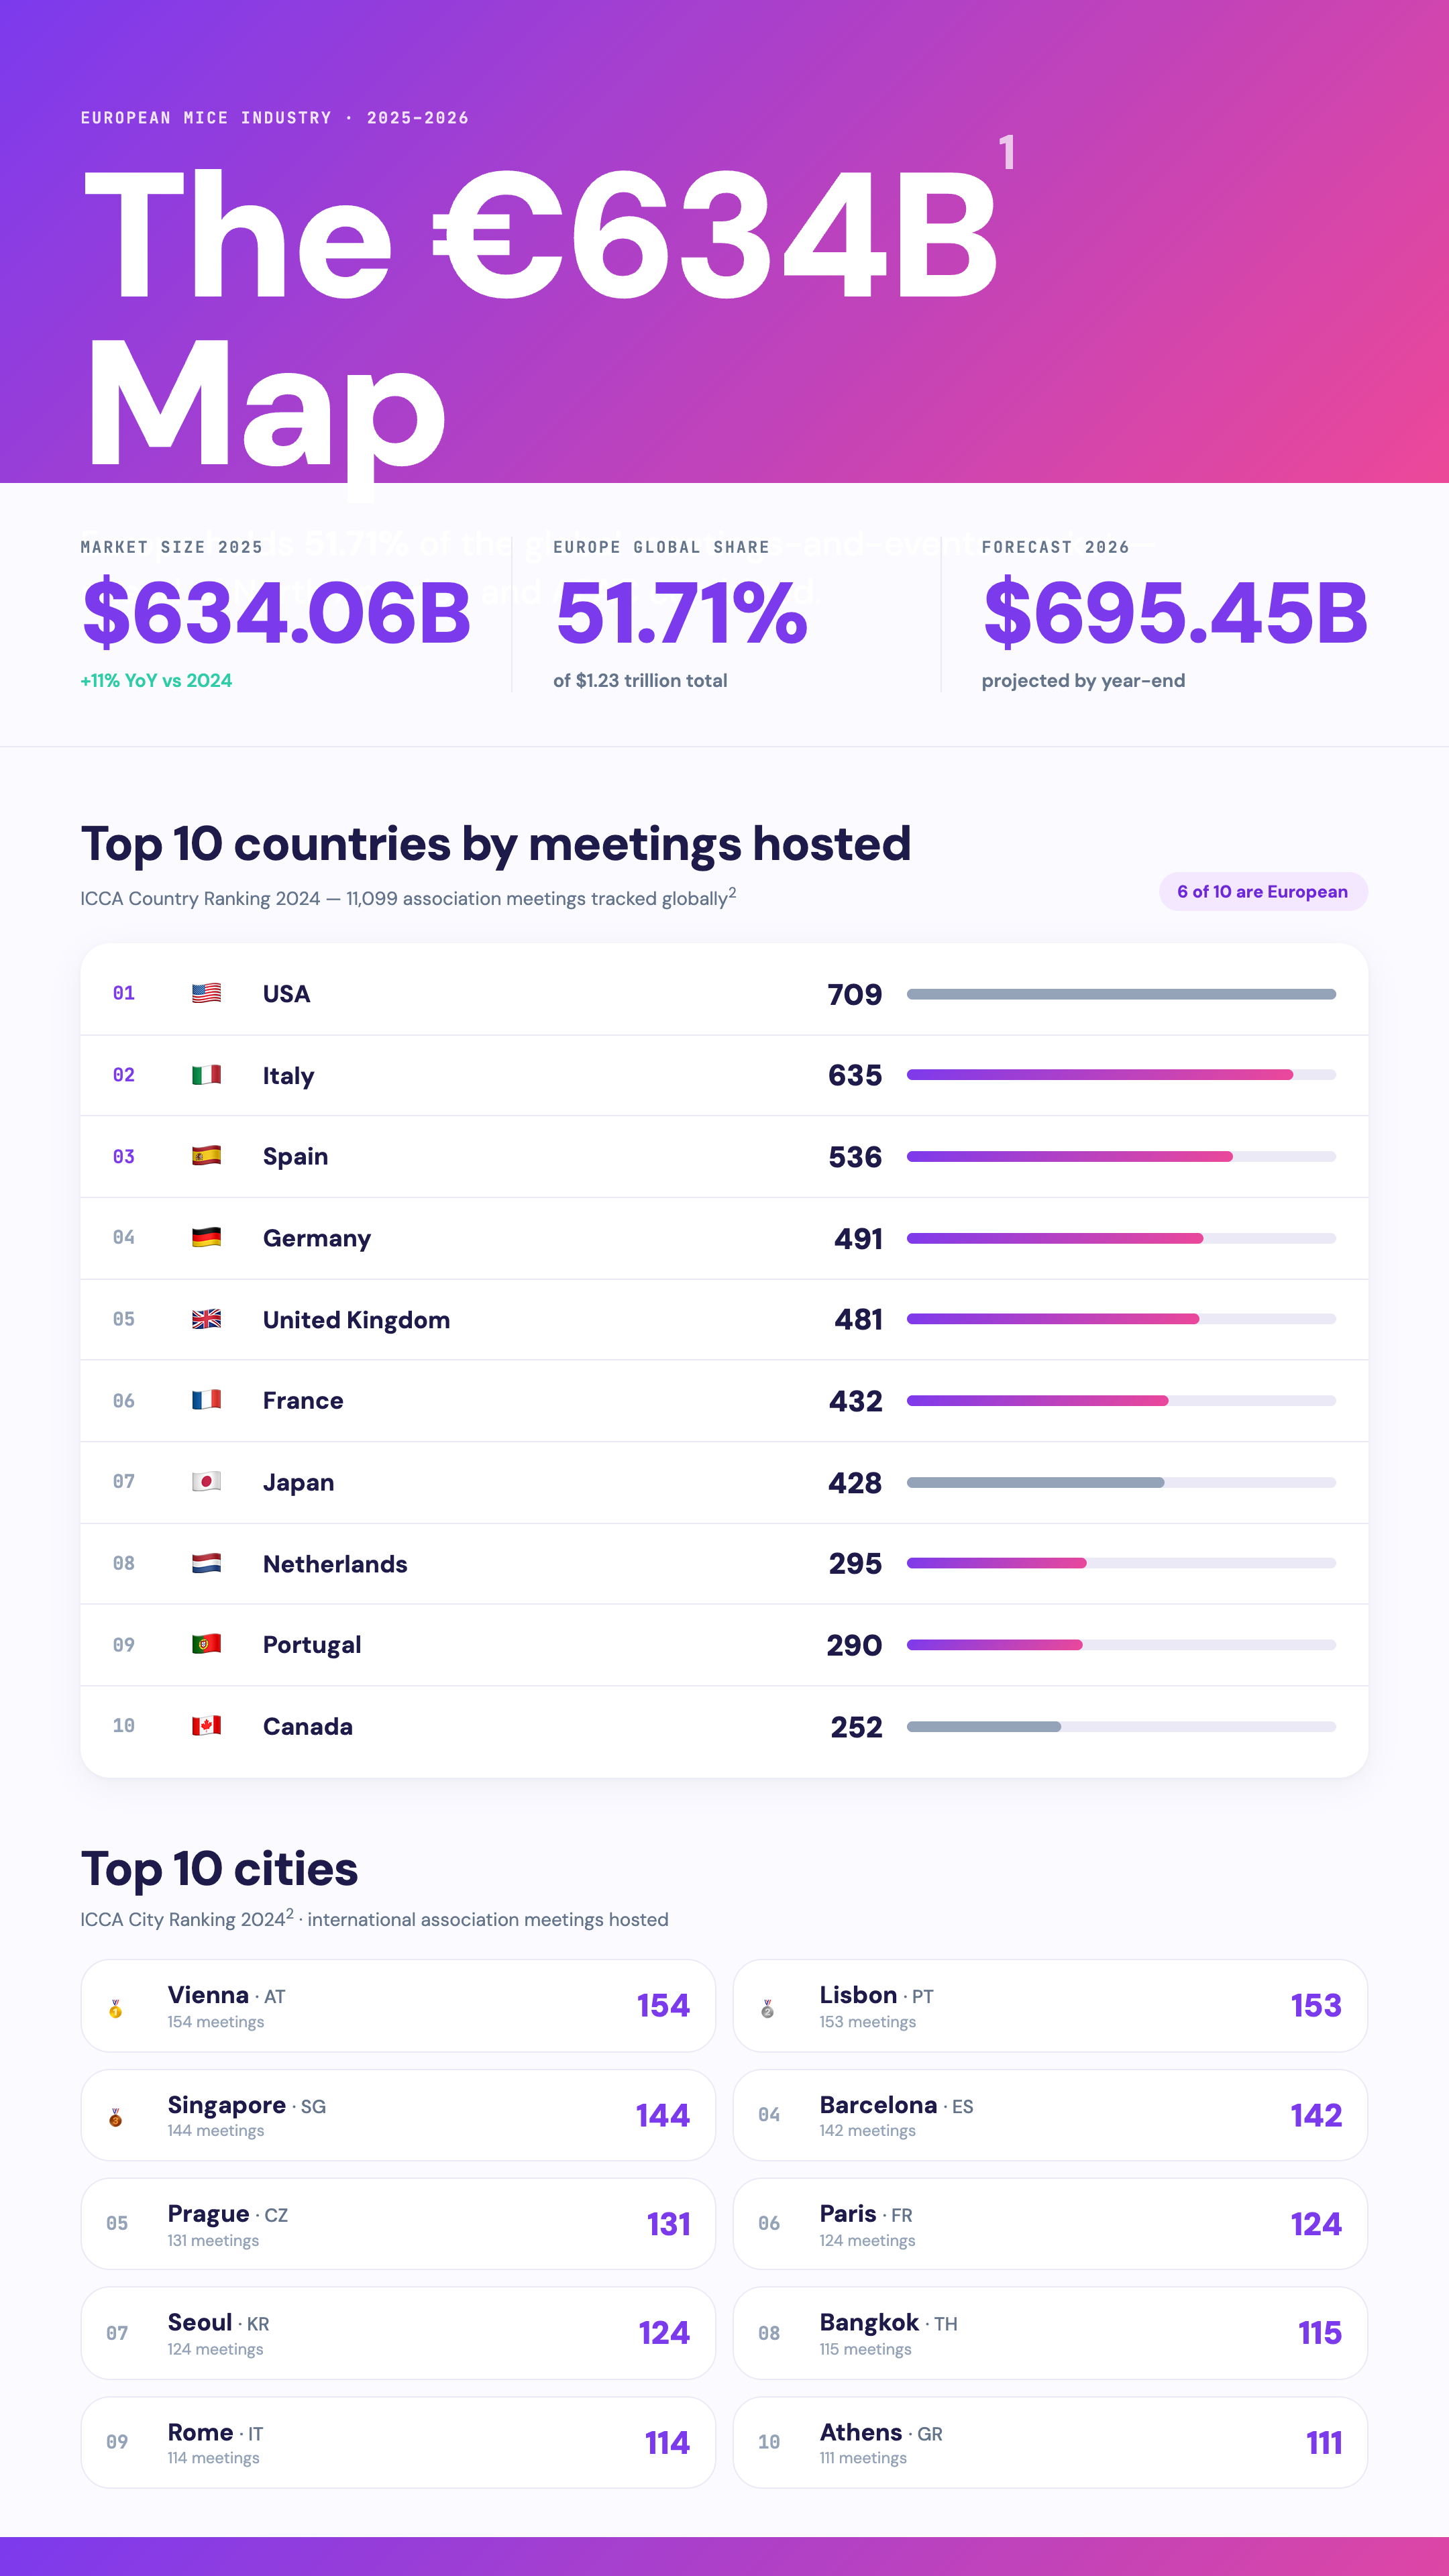
The €634B European MICE Map
Six of every ten meeting-and-events euros spent globally are spent in Europe — and our infographic breaks down where exactly that capital lands.
Read more →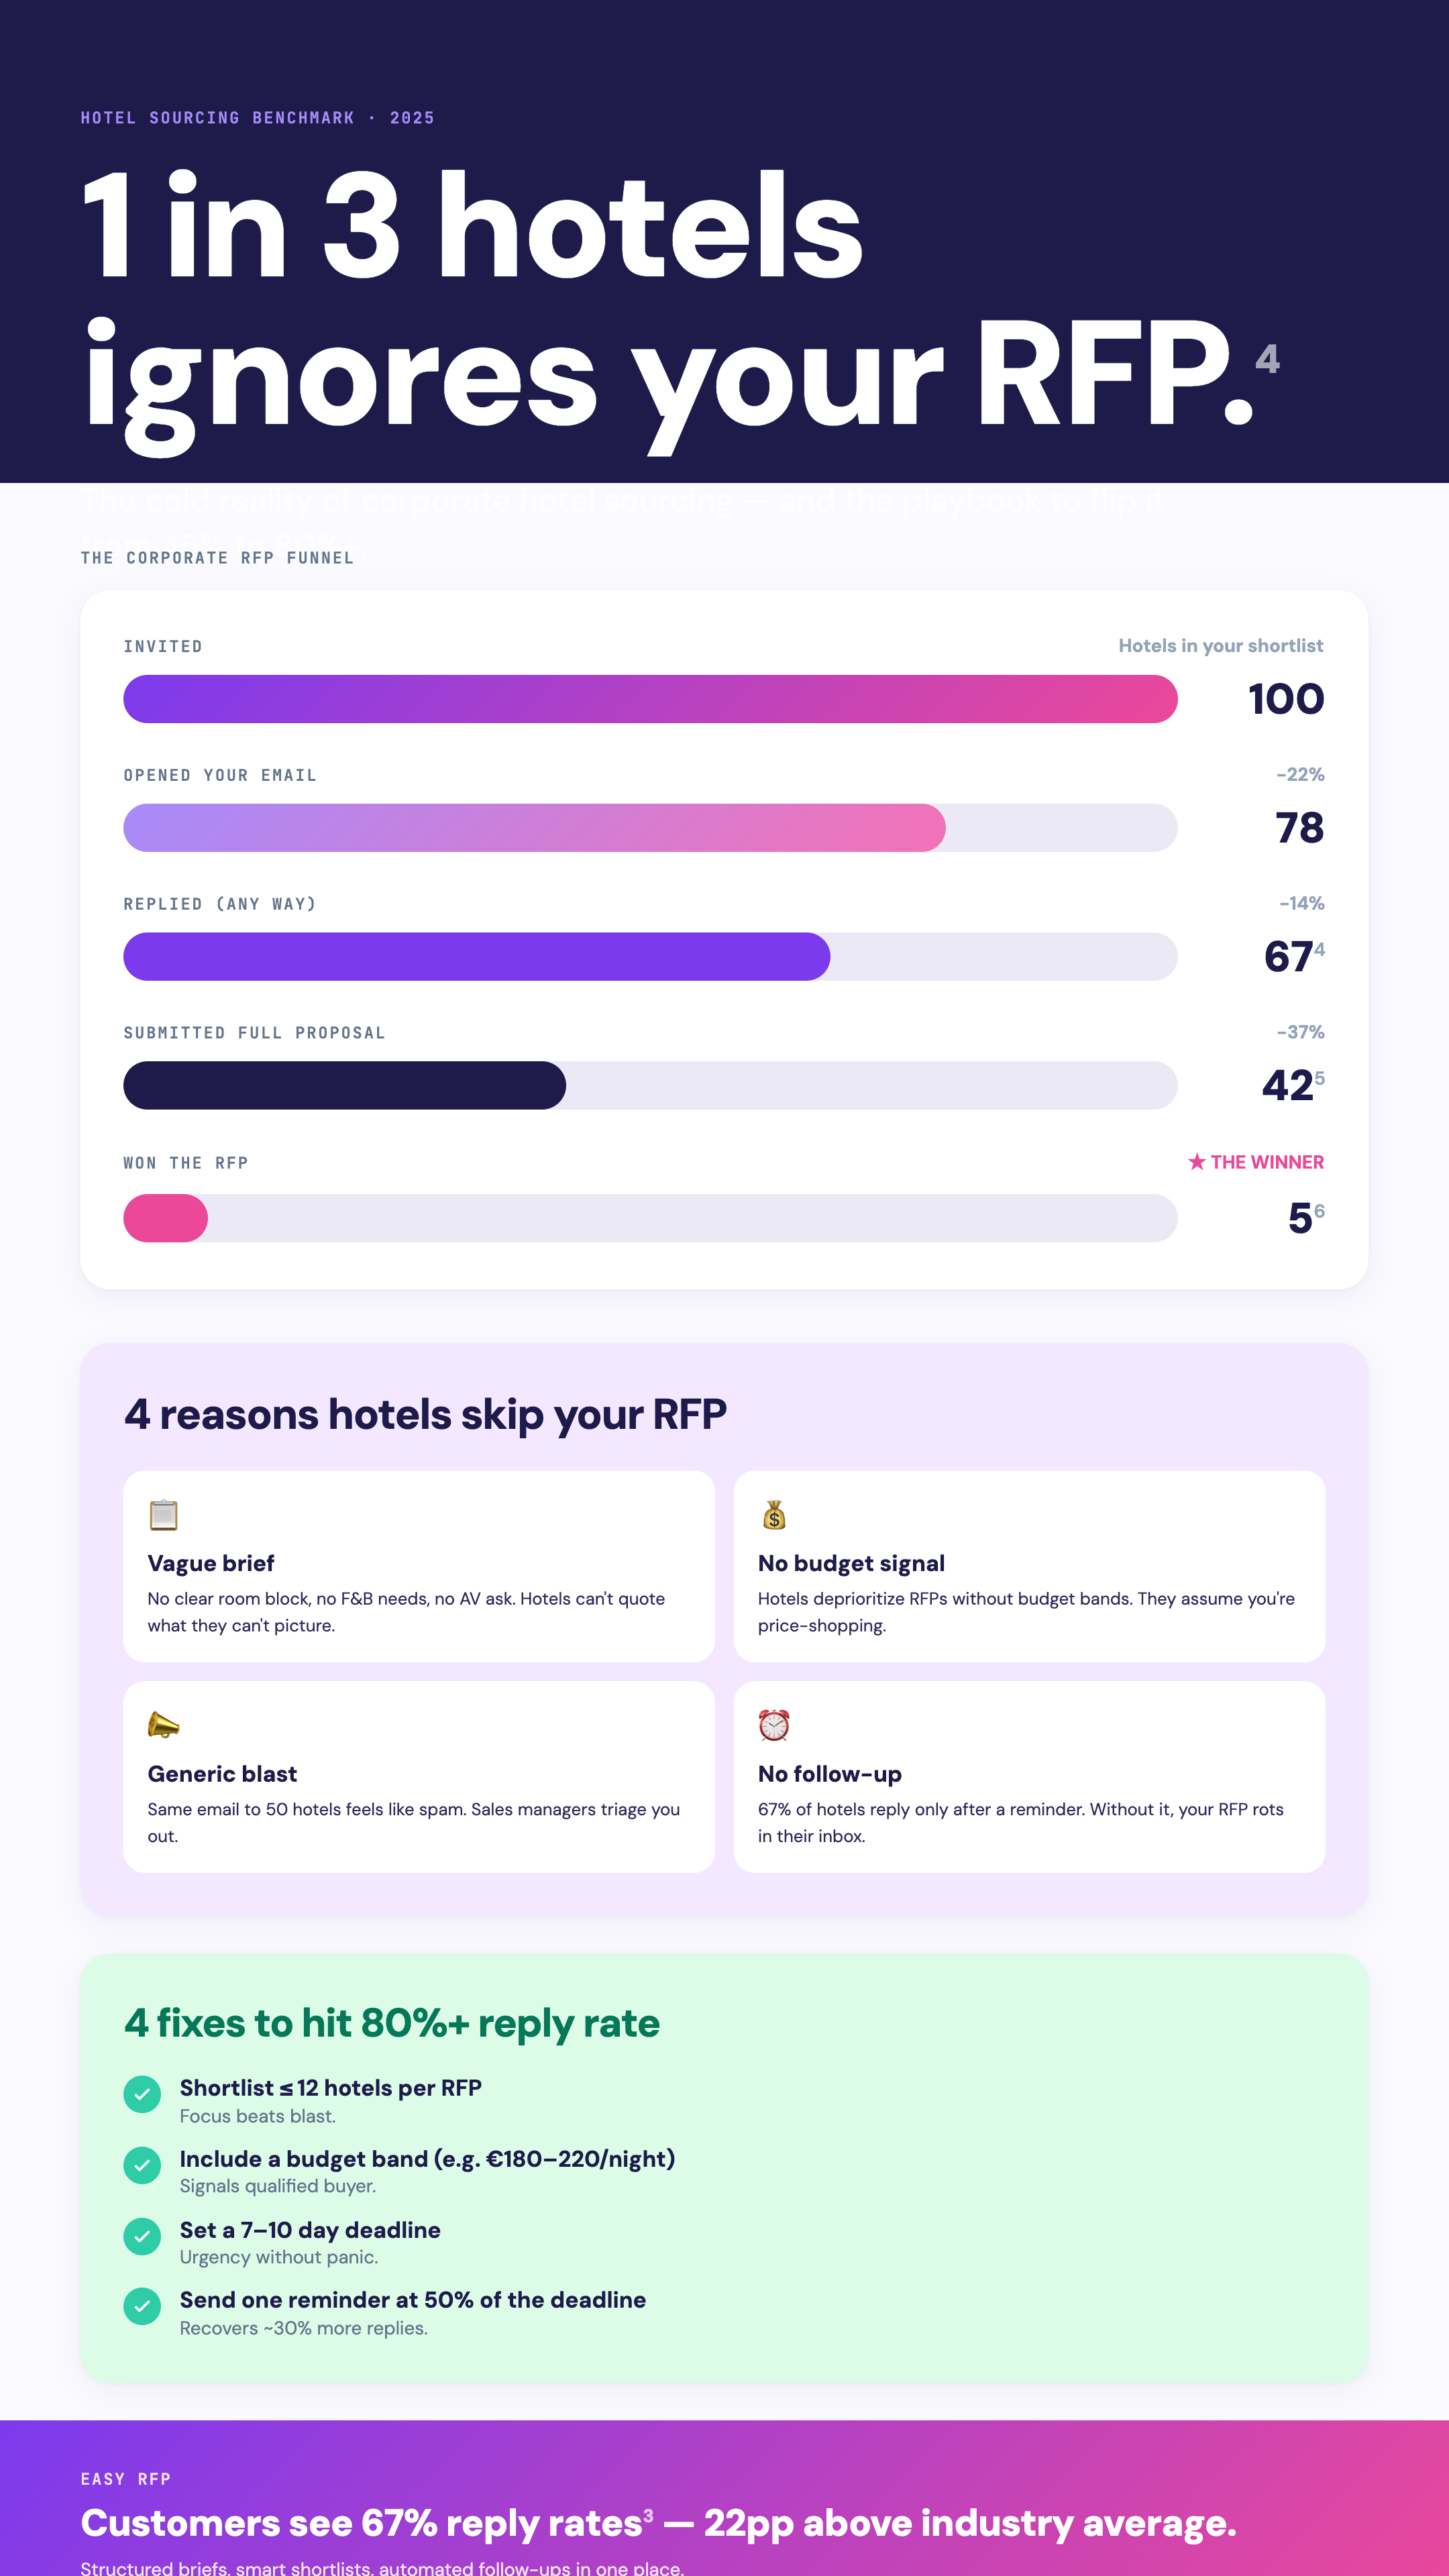
1 in 3 Hotels Ignores Your RFP
Vendelux benchmarks 32-37% of hotel RFPs go un-answered. Here's why — and what it means for your sourcing math.
Read more →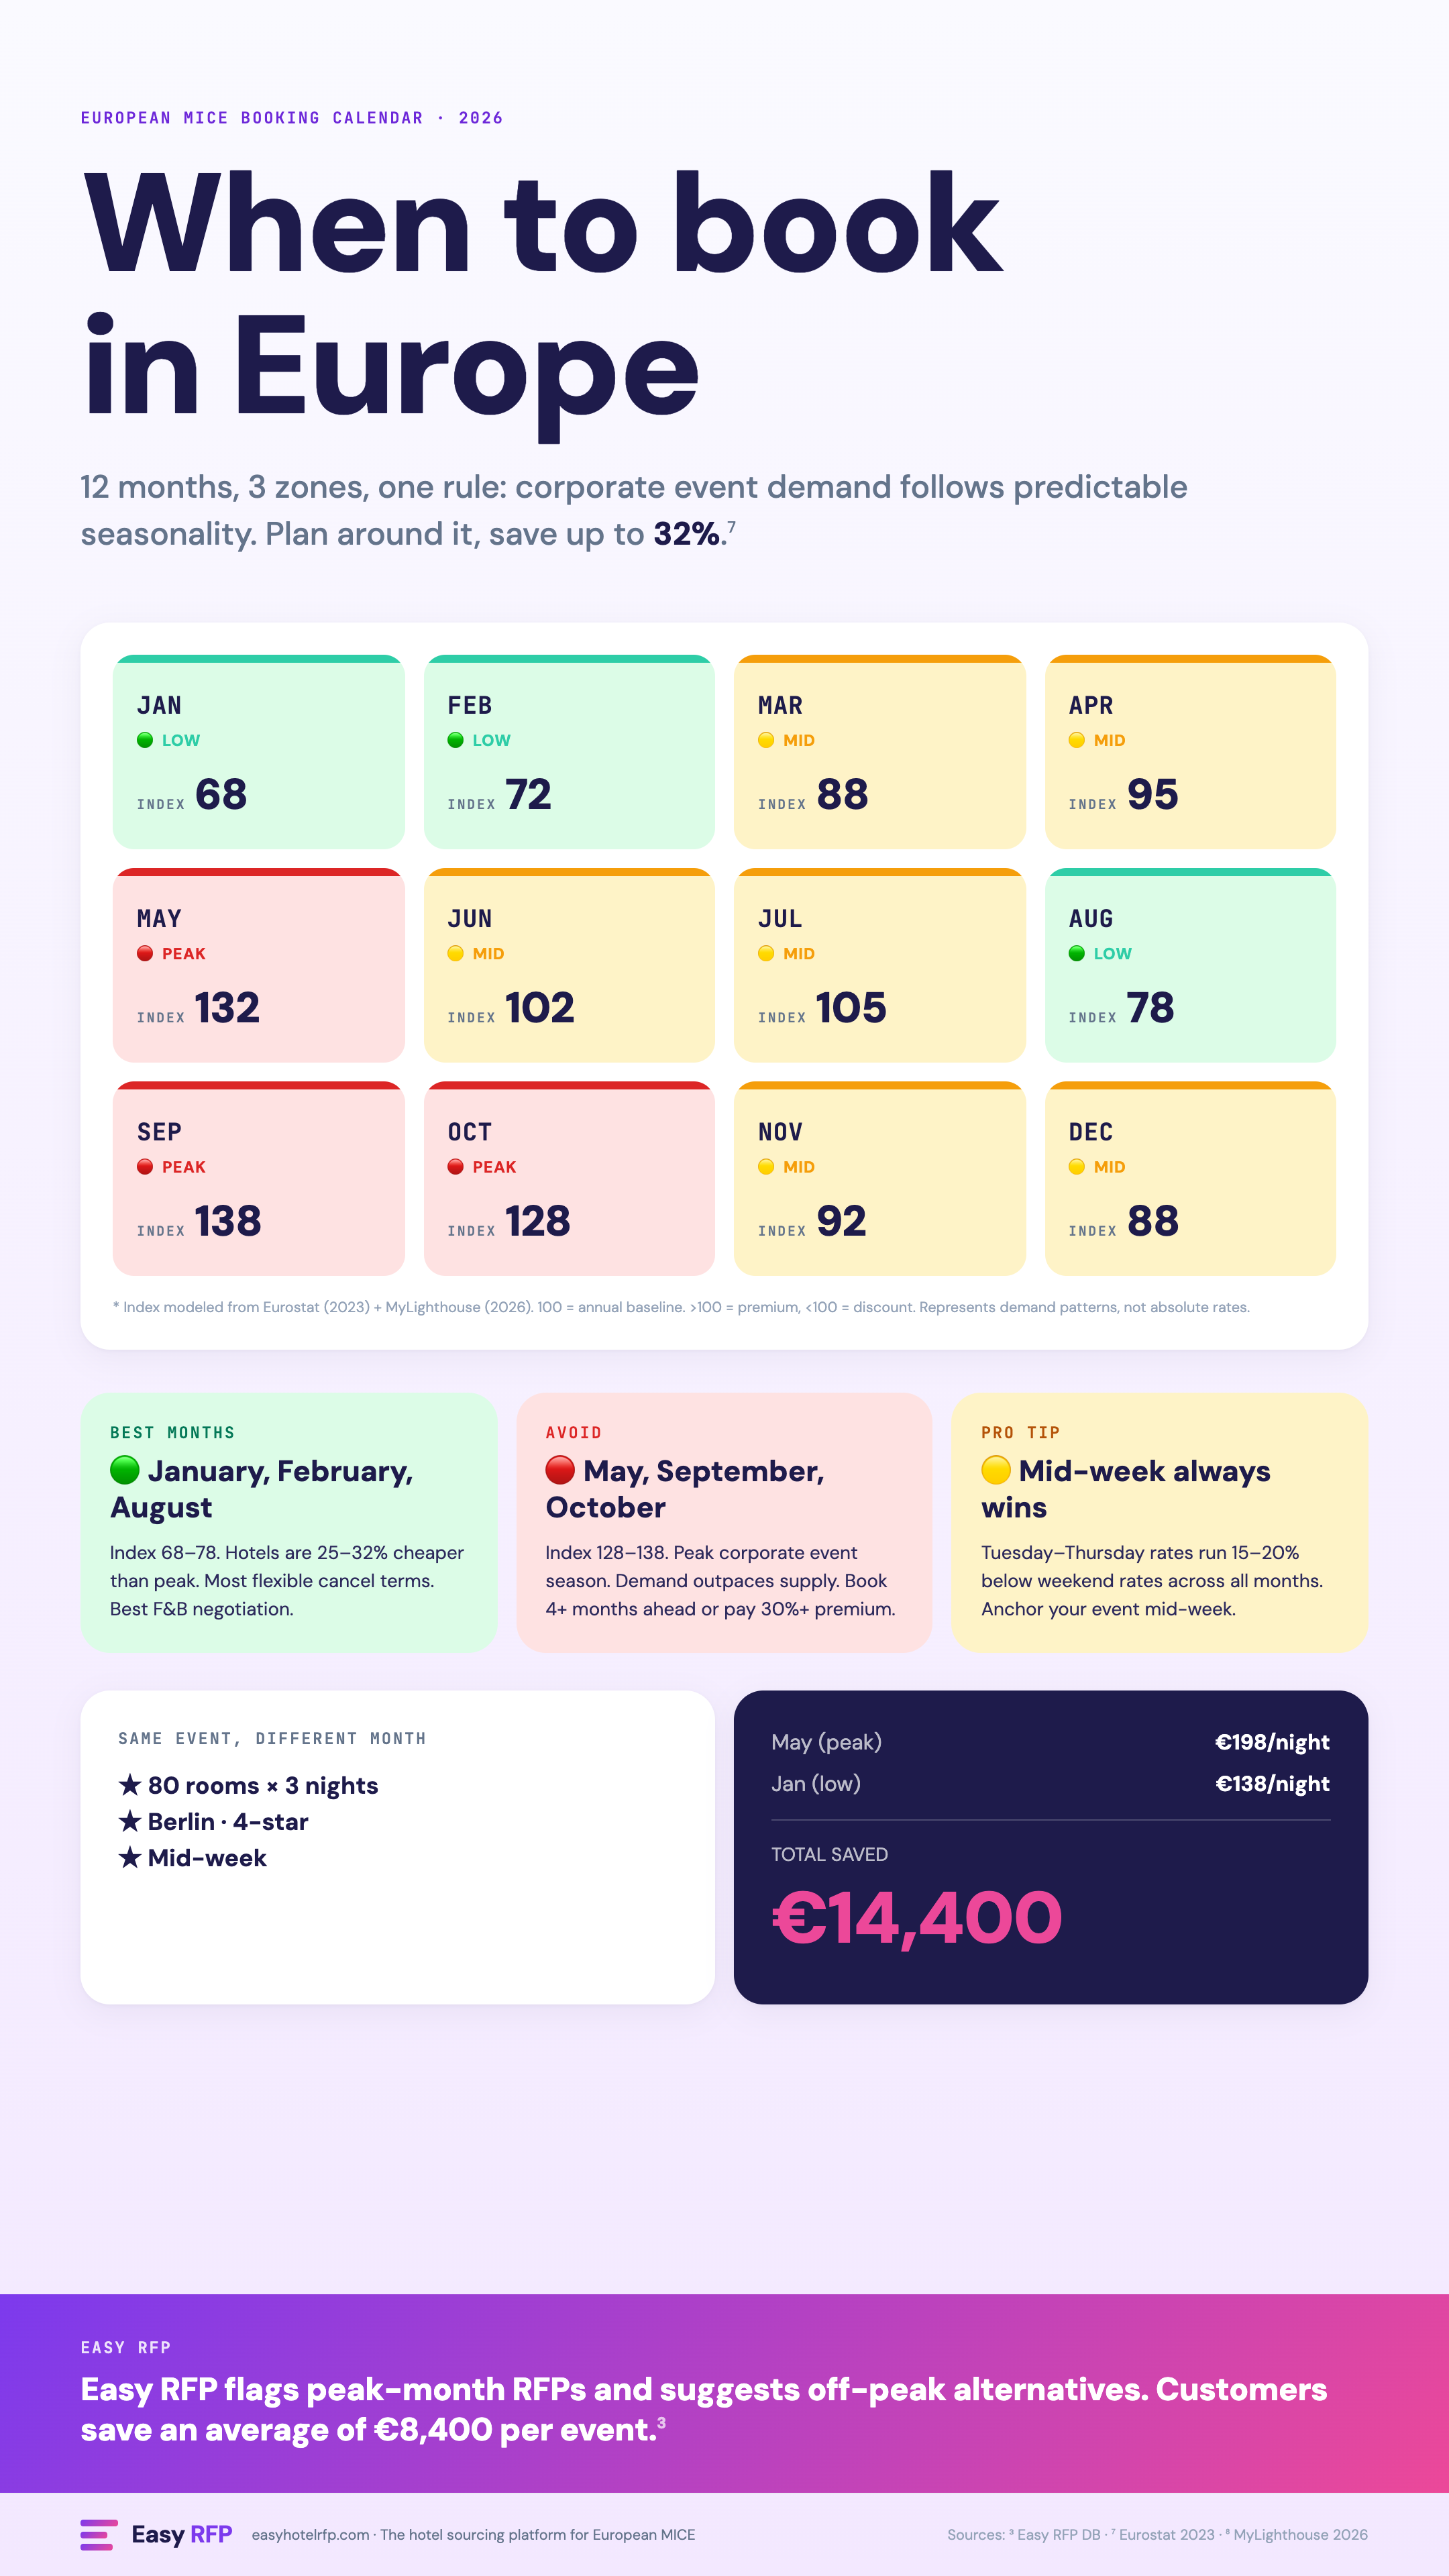
When to Book Hotels in Europe
Booking your event 8 months out vs 3 months out can cut your room block cost 32%. Here's the lead-time savings curve, by city.
Read more →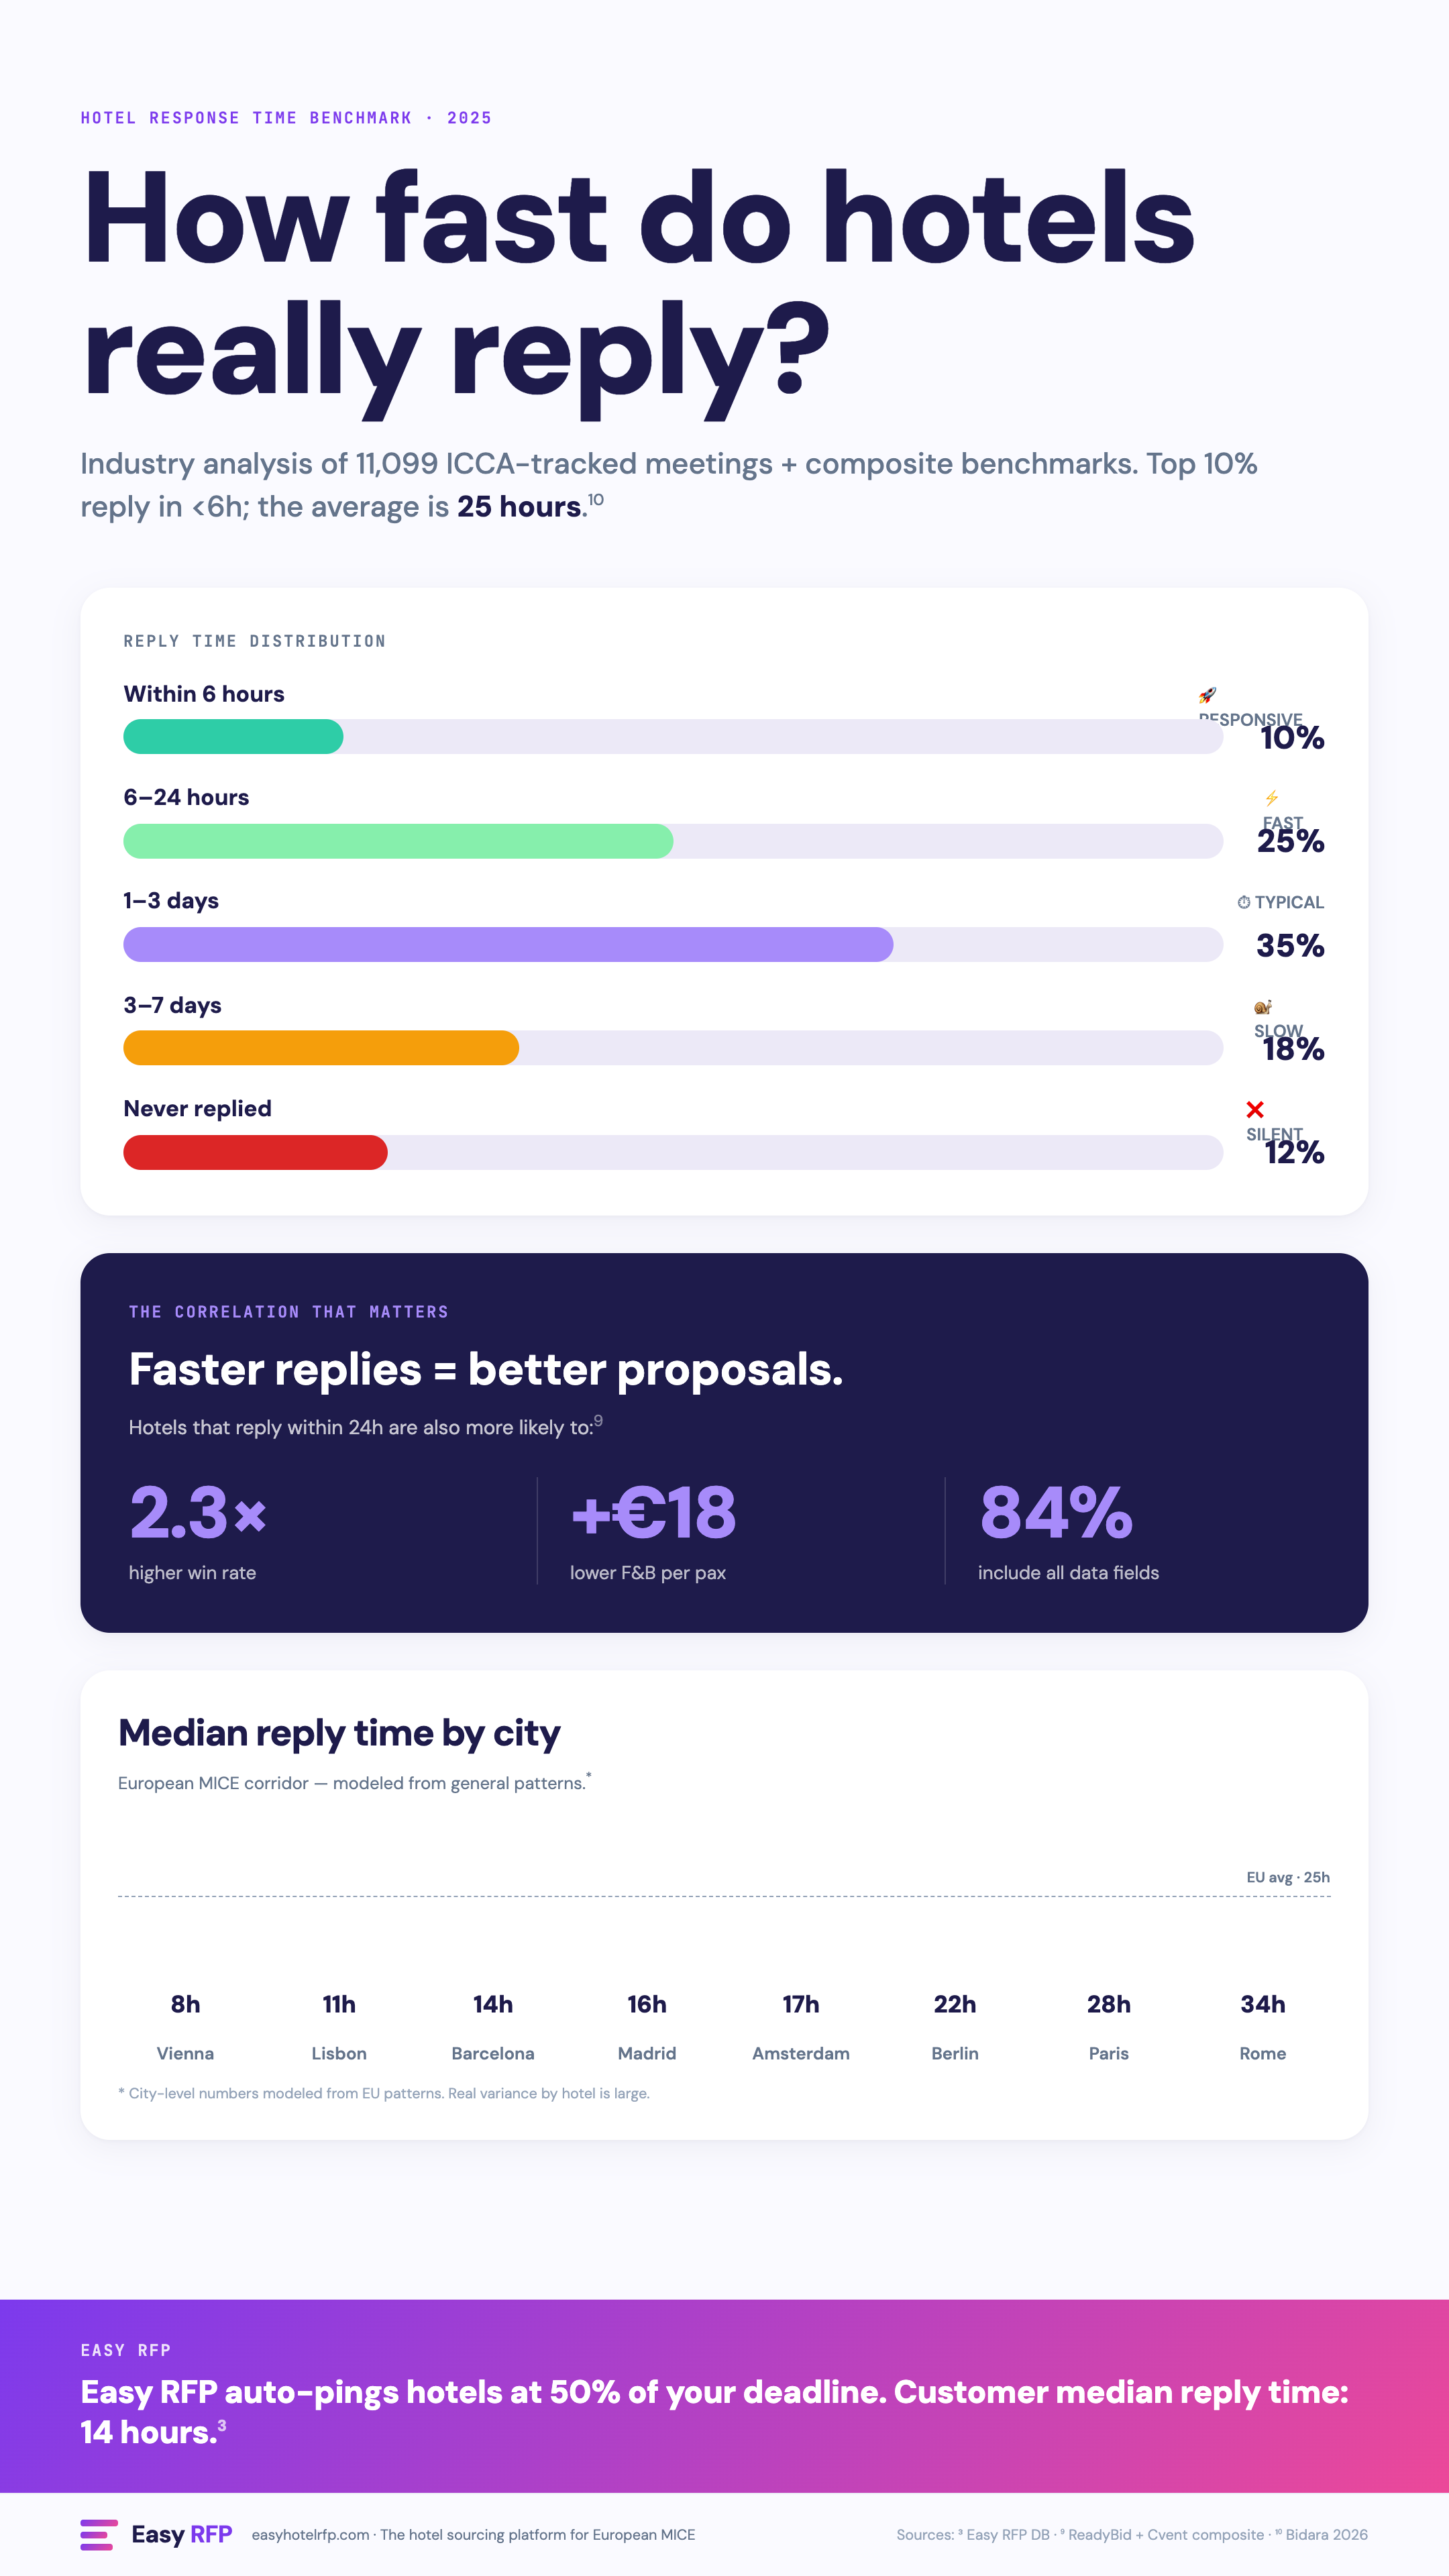
Hotel Reply Time Reality: 25h Average, <6h for Top 10%
The industry boast is 24h. The Vendelux median is 25 hours. The top-10% group? Under 6.
Read more →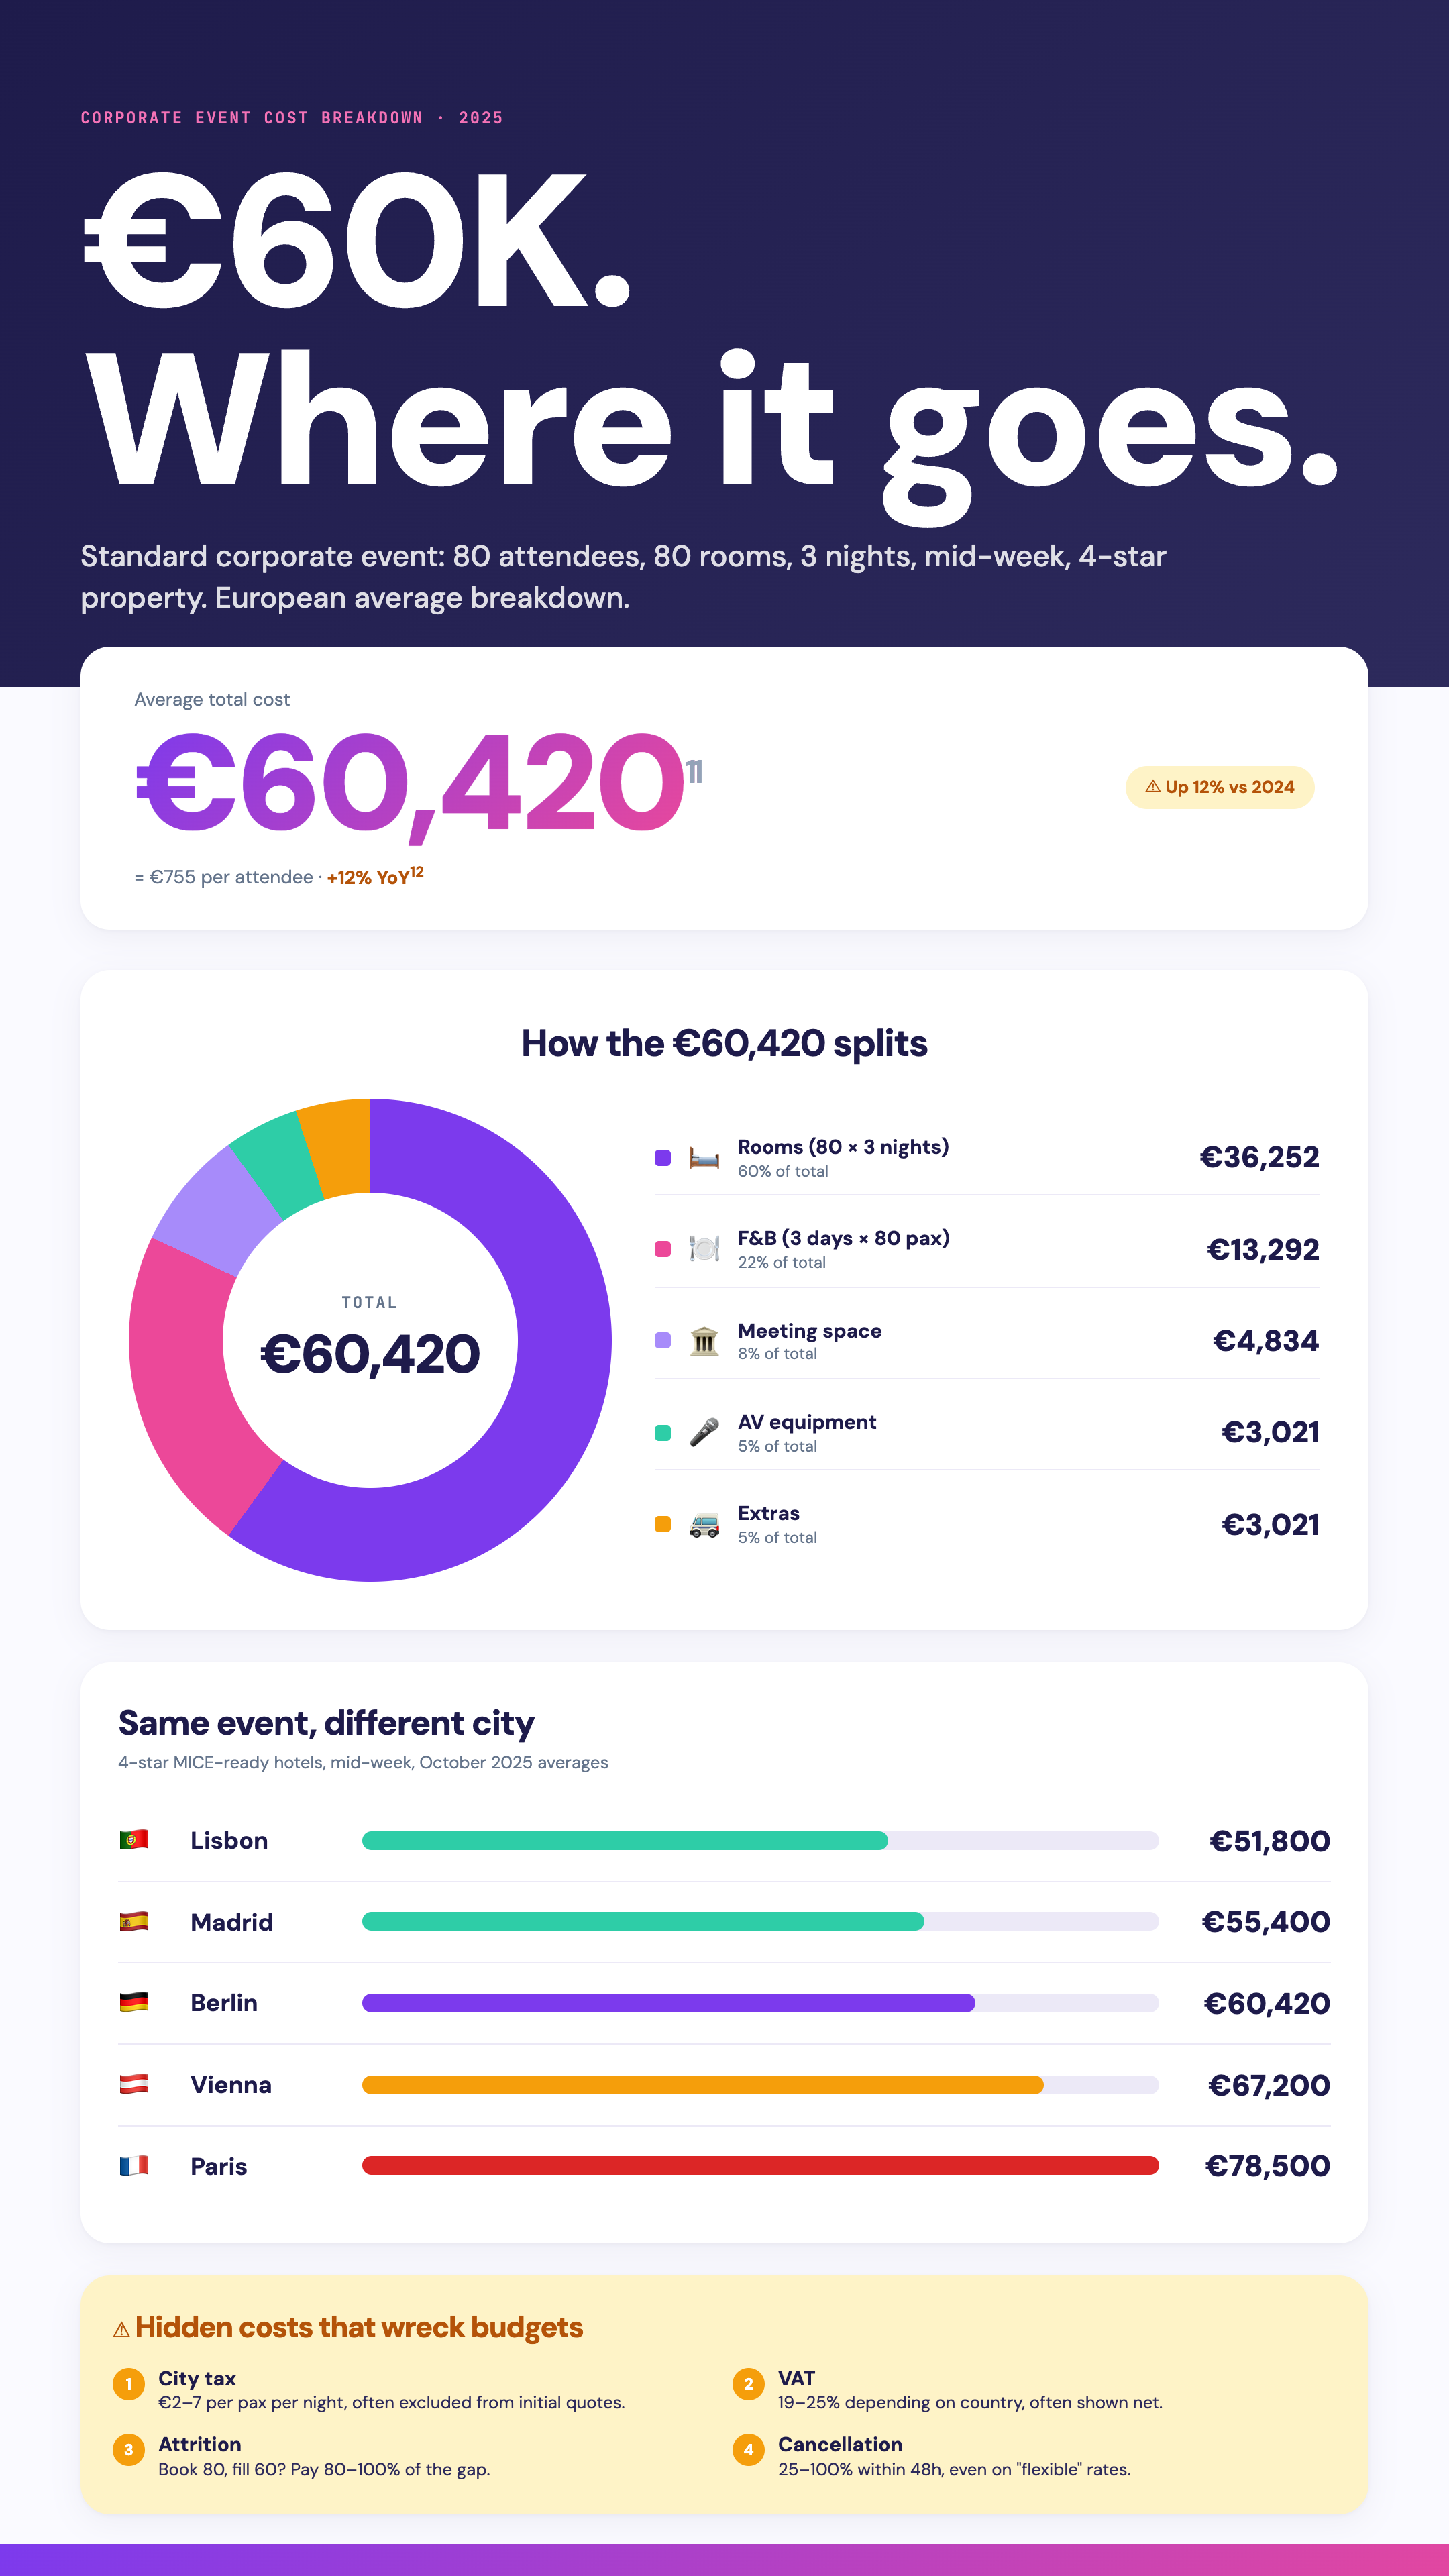
Anatomy of a €60,000 Event
Where every euro of a typical European corporate offsite actually goes — F&B, room block, AV, and the surprising 12% that vanishes into 'incidentals'.
Read more →